Here is the finding before the throat-clearing: home runs drive a lot of run scoring, but they do not drive the most. I took all 30 teams from 2024 and regressed team runs on team home runs, and the slope came back at 2.21 runs per home run with a correlation of r = 0.79 — meaning home run totals explain about 62 percent of the variation in how many runs teams scored. That is a strong link. But it is not the strongest link in the box score, and that gap is the whole argument. On-base ability tracks scoring better, and a blend of on-base and slugging tracks it best of all. The popular instruction to “just hit more homers” is not wrong so much as it is aiming at the second-best target.
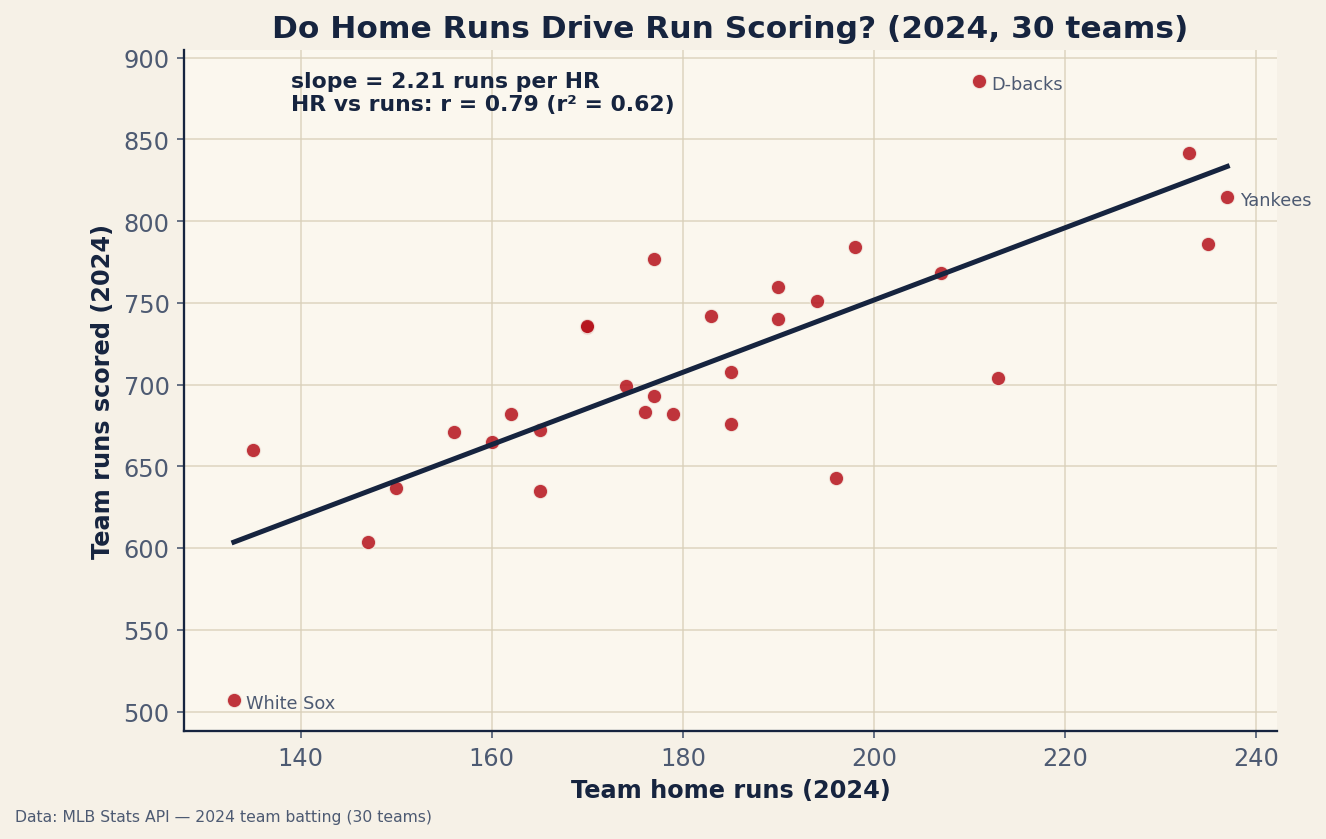
Look at that cloud of 30 dots and notice that it leans up clearly but wanders. The points stray off the line in a way that says home runs are a real part of the story and not the only part. Now hold that picture next to what the other measures do.
The ranking that settles it
I ran the same comparison for the slash rates. Here is how well each measure tracks team runs, by correlation: OPS lands at r = 0.96 (r² = 0.92), OBP and SLG tie at r = 0.93 (r² = 0.86), and home runs trail at r = 0.79 (r² = 0.62). Stack them up — OPS > OBP ≈ SLG > HR — and the home run is in last place among the things people actually argue about.
Put the difference in plain terms. An r of 0.79 versus 0.96 does not sound like much until you square it. Home runs leave 38 percent of scoring unexplained; OPS leaves 8 percent. That is the difference between a measure that knows most of what is going on and one that knows nearly all of it. And the quiet headline is OBP: on-base ability alone, with no credit for power at all, ties slugging and beats raw homers by a wide margin. Not making outs is worth as much as hitting for power, and it is more reliably converted into runs.
Why one homer is worth about 2.2 runs
The 2.21 slope deserves a worked example, because it is easy to misread. A home run scores the batter — that is one run, guaranteed. It also clears whatever runners happen to be on base. A solo shot with the bases empty is worth exactly one run. A three-run shot is worth three. Average those situations across a full season, and a typical homer comes with roughly 1.2 runners already aboard, so the average home run plates about 2.2 runs. That is the literal accounting behind the slope.
There is a second reason the number lands that high, and it is sneakier. The regression is run across teams, and homer-heavy lineups tend to be good all around — they also walk, they also hit doubles, they also avoid outs. So the 2.21 figure is not purely the mechanical value of a home run; it is partly the value of being the kind of offense that hits a lot of home runs. The pure run-creation value of a homer, isolated from everything around it, is smaller. More on that in a moment, because it is where the primary sources come in.
What the comparison does not prove
I will not oversell this, because the honest caveats are doing real work here. First, correlation is not causation, and these measures are badly intertwined. Home runs inflate slugging, and slugging is half of OPS, so HR, SLG, and OPS are not independent variables racing on a level track — the “winner,” OPS, has the home run baked into it. The fair reading is not “homers don’t matter” but “homers matter as one ingredient of slugging, and slugging plus on-base beats slugging alone.”
Second, this is one 30-team season. Thirty data points is enough to see a clear signal but not enough to nail an r-value to the second decimal — every correlation here carries sampling noise, and 0.93 versus 0.93 for OBP and SLG should be read as “about tied,” not as a measured dead heat. Run this on 2023 or 2022 and the numbers would wobble.
Third, team-level analysis hides everything that happens below the team. Park effects vanish — a homer in Coors and a homer in a pitcher’s park count the same in these totals. Lineup context vanishes. And the home run column is a raw count, not rate-adjusted for plate appearances, so a team that simply batted more times gets quiet credit it did not earn on a per-chance basis. Finally, the whole “long ball versus small ball” framing is a simplification; real offenses are not built at one of two poles, and the interesting teams sit in the messy middle. If you want the cleaner question of which single stat best forecasts wins rather than runs, I worked that out separately in which hitting stat predicts wins.
What the old hands already knew
None of this is a new discovery, and it would be dishonest to pretend otherwise. The linear-weights tradition — Pete Palmer and John Thorn’s The Hidden Game of Baseball — long ago priced a home run at roughly 1.4 runs of linear weight, the marginal run value of the event itself, stripped of context. So why does my raw team regression say 2.21? Because the two numbers are answering different questions. Linear weights ask, “what is the run value of one more home run, holding everything else fixed?” My team regression asks, “how many more runs do teams that hit one more homer actually score?” The second number is bigger precisely because it includes all the correlated good things homer-hitting teams do. The gap between 1.4 and 2.2 is not a contradiction; it is the size of that correlation. I unpack the linear-weights machinery in linear weights run values explained.
The on-base half of the story is the Moneyball argument, and the 2024 data restates it cleanly: the scarce, undervalued skill is not making outs. An out is the one currency a hitter can never get back, and OBP measures exactly how well a hitter hoards it. That OBP ties slugging in tracking runs — despite giving zero credit for the distance a ball travels — is the empirical core of the whole on-base revolution. It also connects to the three-true-outcomes shift in how modern lineups are built, and to the long argument over whether OPS+ or wRC+ is the better park-adjusted bat metric — both of which exist because raw OPS, good as it is, still treats an on-base point and a slugging point as equal when they are not quite.
Reproduce it yourself
Everything here is one script over one file. charts/chart_hr_run_scoring.py reads the bundled data_layer/team_batting_2024.json — all 30 teams, 2024, straight from the MLB Stats API, carrying home runs, runs scored, and the OBP/SLG/OPS slash rates — then regresses runs on home runs to get the 2.21 slope and the 0.79 correlation, and computes each measure’s correlation with runs to produce the OPS-OBP-SLG-HR ranking. Every figure in this piece falls out of that run. If you would rather feel how runs convert into standings once you have them, the Pythagorean and run tools on the calculators page take it from there.
Sources & further reading
- Free textbook: Chapter 22: Correlation and Simple Linear Regression — the theory behind this, at DataField.dev.
- Primary data: MLB Stats API, bundled here as
data_layer/team_batting_2024.json(all 30 teams, 2024, with HR, runs, and OBP/SLG/OPS), with the regression and correlations run bycharts/chart_hr_run_scoring.py. - Origins: Pete Palmer & John Thorn, The Hidden Game of Baseball — the linear-weights tradition that prices a home run at about 1.4 runs — and the Moneyball on-base argument that the scarce skill is not making outs.
- Related: which hitting stat predicts wins, linear weights run values explained, and OPS+ vs. wRC+.