There are three things that can happen at a plate appearance without a single fielder so much as bending his knees: the batter homers, the batter walks, or the batter strikes out. Everything else — the grounder to short, the lazy fly, the line drive into the gap — hands the ball to the defense and lets nine gloves decide the outcome. The first three are settled strictly between the pitcher and the hitter. Sabermetrics long ago gave them a name: the three true outcomes.
For most of baseball history they were a sideshow, the signature of a few all-or-nothing sluggers. They are now the main event. In 1921, the three true outcomes accounted for just 15.4% of plate appearances. In 2025 they accounted for 33.7% — roughly one trip to the plate in three ends with the defense standing around, watching.
What counts as a “true” outcome
The phrase is older than Statcast and a little tongue-in-cheek, but the logic is real. A true outcome is one the defense cannot influence. A home run clears the fence; no outfielder catches it. A walk sends the batter to first on the pitcher’s say-so. A strikeout is recorded by the pitcher and catcher alone. In each case the seven other fielders are spectators, and the result is a clean measurement of the pitcher-versus-hitter duel with the messy variable of fielding removed.
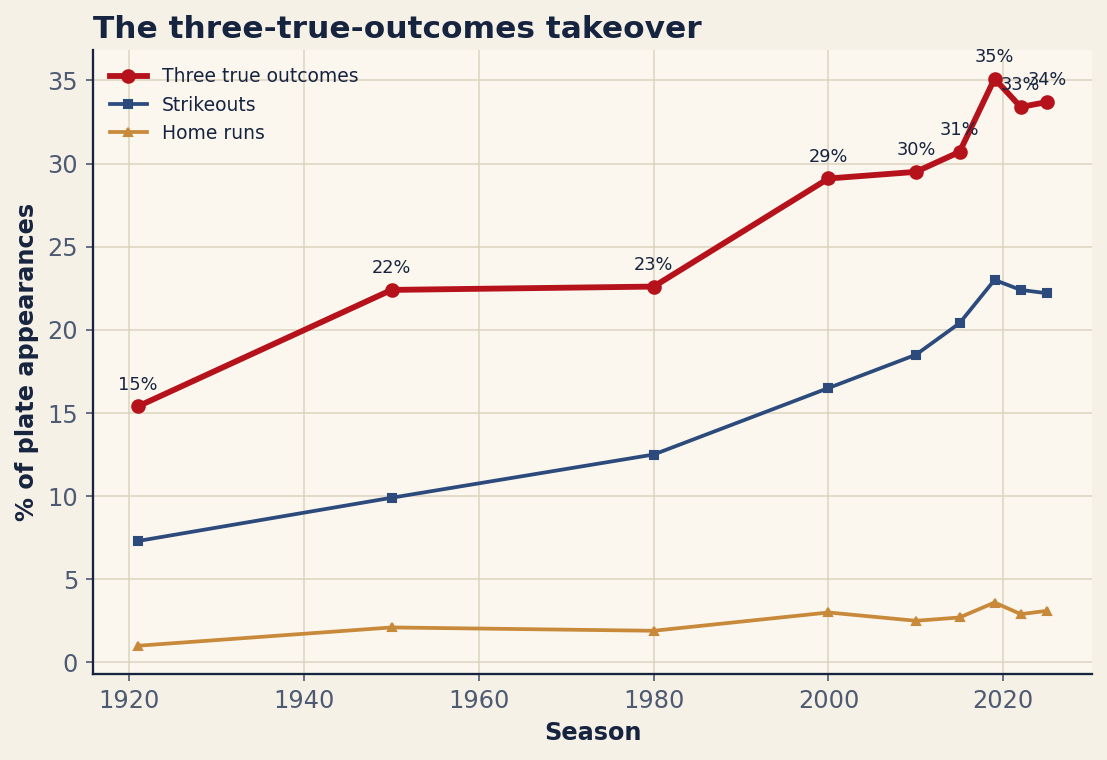
That purity is exactly why analysts liked the category in the first place: it isolates the part of the game that two players control completely. But when a third of all plate appearances fall into it, the statistic stops describing a quirky subset of hitters and starts describing the texture of the sport. The chart below traces all three components from the live-ball era to the present.
A century-long climb
The trend is not a recent blip; it is a hundred-year ramp with a few distinct accelerations. The full-season splits make the shape concrete.
| Season | TTO% | HR% | BB% | K% |
|---|---|---|---|---|
| 1921 | 15.4 | 1.0 | 7.2 | 7.3 |
| 1950 | 22.4 | 2.1 | 10.3 | 9.9 |
| 1980 | 22.6 | 1.9 | 8.2 | 12.5 |
| 2000 | 29.1 | 3.0 | 9.6 | 16.5 |
| 2010 | 29.5 | 2.5 | 8.5 | 18.5 |
| 2015 | 30.7 | 2.7 | 7.7 | 20.4 |
| 2019 | 35.1 | 3.6 | 8.5 | 23.0 |
| 2022 | 33.4 | 2.9 | 8.2 | 22.4 |
| 2025 | 33.7 | 3.1 | 8.4 | 22.2 |
Read the table top to bottom and the story tells itself. In 1921, Babe Ruth’s first full season as a Yankee, home runs were a 1.0% event and strikeouts a 7.3% one; the three true outcomes together barely cracked 15%. By 1950 the figure had jumped to 22.4%, powered mostly by walks (10.3%) and the post-Ruth embrace of the home run. Then came a long plateau: 1980 sits at 22.6%, essentially unchanged from thirty years earlier, even as strikeouts crept up to 12.5%. The modern surge starts around the turn of the century — 29.1% in 2000 — and never really stops.
The strikeout does most of the lifting
If you want one number to explain the takeover, it is the strikeout rate. It is the only one of the three components that has risen more or less monotonically for a century, and it has risen the most. From 7.3% of plate appearances in 1921 it reached 16.5% in 2000, 20.4% in 2015, and a peak of 23.0% in 2019 before settling at 22.2% in 2025. Walks, by contrast, have been remarkably stable — 7.2% in 1921, 8.4% in 2025, wandering inside a narrow band the whole time — and home runs, while up sharply from that 1.0% baseline, sit at a comparatively modest 3.1%.
So the air-or-nothing era is, more than anything, a strikeout era. The reasons are by now familiar to anyone who has watched a fastball read 99 on the board. Velocity has climbed across the league; breaking balls move more and arrive later; bullpens churn fresh power arms through the late innings so a hitter rarely sees a tiring pitcher. We dig into that dynamic on its own terms in our look at the strikeout era, but the headline is simple: missing bats has never been easier.
Swinging for damage
The hitters are not innocent bystanders in this. The launch-angle revolution taught a generation of batters that a fly ball is worth far more than a ground ball, and that the path to runs runs through the outfield seats rather than between the infielders. Swing planes tilted upward, exit velocities became a coaching obsession, and the implicit bargain changed: hitters accepted more swing-and-miss as the price of more damage when they connected.
It is a rational trade. A home run is the single most valuable event in baseball, and if elevating the ball turns a few extra singles into a few extra homers, a hitter can come out ahead even while striking out more. The cost shows up in the strikeout column, but the payoff shows up in that 3.1% home-run rate — triple the 1.0% of Ruth’s day. The deeper counts that come with a damage-first approach also nudge the walk rate up at the margins, since a hitter hunting a specific pitch will let more borderline offerings go by.
The same forces that fuel the strikeout, in other words, also fuel the home run, and a hitter who has decided to sell out for contact quality is choosing two of the three true outcomes at once. The pitcher, throwing harder and nastier, is happy to supply the third.
What it costs the sport
Every percentage point added to the three true outcomes is a percentage point subtracted from balls in play — from the diving stops, the gap doubles, the runners going first to third, the relay throws. The action that defines baseball as a fielding sport happens on contact, and contact is precisely what the modern game produces less of. When a third of plate appearances resolve with no ball put in play, a meaningful share of any given broadcast is, by construction, free of defense.
League officials have noticed. The pitch clock, the larger bases, and the limits on infield positioning are all, in part, attempts to put the ball back in play and the fielders back in motion. The three-true-outcomes line is the scoreboard for that effort: as long as it sits near 33.7%, the air-or-nothing era is intact. The arms are a big reason why, and the shifting menu of pitches hitters now face — charted in our piece on the shrinking fastball — is the other half of the same story.
The bottom line
The three true outcomes were coined as a label for outliers — the Rob Deer and Adam Dunn types who walked, whiffed, and homered and did almost nothing else. The joke has become the league. A category that described 15.4% of plate appearances in 1921 now describes 33.7% of them, and the climb has been driven overwhelmingly by the strikeout, with the home run a clear second and the walk holding steady in the background. Whether you read that as the natural endpoint of optimizing every at-bat or as a problem the rulebook is right to chase, the number is the number: a third of modern baseball now happens with the defense watching.
Sources & Further Reading
- Free textbook: Chapter 11: Working with Dates, Times, and Time Series Data — the theory behind this, at DataField.dev.
- Historical league hitting data: MLB.com (MLB Stats API). Numbers retrieved June 2026; re-runnable via
scripts/three_true_outcomes.py. - Baseball-Reference — season-by-season league batting totals for cross-checking.
- SABR — on the origin and history of the “three true outcomes” concept.