Establish the fastball. Pitch off the fastball. Challenge a hitter with the fastball. For a century that was the catechism, and everything else in a pitcher’s repertoire got defined in relation to the heater — the fastball was the noun and the breaking ball was the adjective. That sentence is quietly being rewritten, one season at a time.
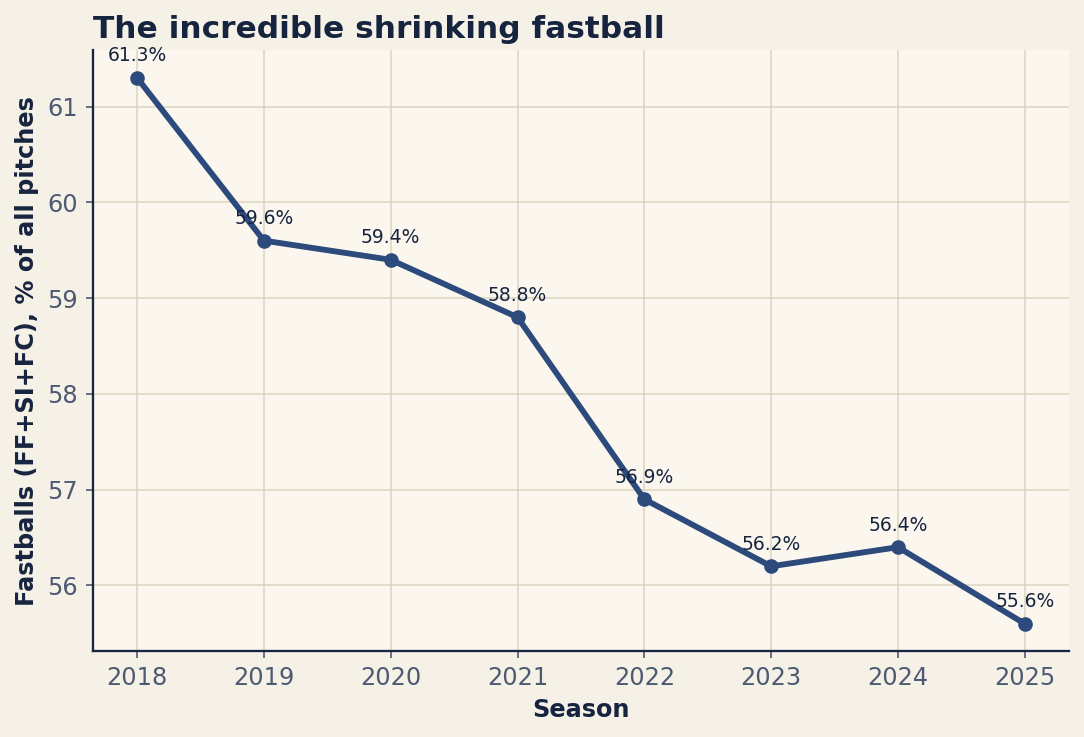
In 2018, fastballs — four-seamers, sinkers, and cutters together — made up 61.3% of every pitch thrown in the major leagues. By 2025 that share had fallen to 55.6%. There was no single dramatic season, no rule change to point to; just a steady, year-after-year retreat as sliders, sweepers, splitters, and curveballs ate into the fastball’s territory. The pitch that used to be the default is, slowly, becoming the exception.
What counts as a fastball
The figures here bundle three pitches under the fastball banner: the four-seam fastball, the sinker (or two-seamer), and the cutter. They share the basic identity of a hard pitch thrown with relatively little break, the kind a pitcher can command in the zone and lean on early in a count. Everything else — sliders, sweepers, curveballs, changeups, splitters — falls outside the group. The decline charted below is the decline of that whole hard-pitch family, not just the classic four-seamer.
A steady, deliberate retreat
What makes the trend persuasive is its consistency. This is not a noisy line that happens to be lower at the end; it is a near-monotonic slide, season over season, through a stable run environment. The yearly shares make that plain.
| Season | Fastball % | Fastball pitches | Total pitches |
|---|---|---|---|
| 2018 | 61.3 | 430643 | 702333 |
| 2019 | 59.6 | 424213 | 711980 |
| 2020 | 59.4 | 144079 | 242525 |
| 2021 | 58.8 | 405264 | 689683 |
| 2022 | 56.9 | 391843 | 688895 |
| 2023 | 56.2 | 392020 | 698014 |
| 2024 | 56.4 | 389323 | 690008 |
| 2025 | 55.6 | 383029 | 689293 |
From 61.3% in 2018 the number steps down almost every year: 59.6%, then 59.4% in the short 2020 season, 58.8% in 2021, a larger drop to 56.9% in 2022, and on down to 55.6% in 2025. The total number of pitches thrown barely moves — roughly 690,000 in a full season — so this is not a sampling artifact. Pitchers are throwing about the same number of pitches and simply choosing to make fewer of them fastballs. Across these seasons that is a swing of nearly six percentage points, which at league scale is tens of thousands of fastballs per year that became something else.
Why pitchers stopped trusting the heater
The blunt reason is that hitters crush fastballs. A straight pitch traveling in a predictable line is the easiest offering to time, and the launch-angle generation has gotten very good at doing damage on exactly that pitch. When the pitch you throw most often is also the pitch hitters most want to see, the incentive to throw it less is obvious. Every percentage point of fastball usage a pitcher sheds is a percentage point of his most hittable offering taken off the menu.
For decades pitchers threw the fastball anyway, because the alternatives were either hard to command or hard to throw consistently. That constraint is the thing that has actually changed.
The pitch-design boom
The real engine of the shrinking fastball is the pitch-design revolution. High-speed cameras and ball-tracking devices let a pitcher see exactly how his hand is spinning the ball — the axis, the spin rate, the movement profile — and then adjust a grip until the pitch does what the data says it should. A breaking ball that once took years of feel to develop can now be reverse-engineered in a bullpen over a winter.
The clearest product of that boom is the sweeper, a slider tuned for huge horizontal break that barely existed as a named pitch a decade ago and is now thrown across the league. It is part of the same story as the fastball’s decline: every sweeper a pitcher adds is, usually, a fastball he subtracts. We trace that specific pitch’s rise in our look at the pitch-design revolution and the sweeper, but the general principle is broader than any one grip. When spin and movement become measurable and therefore teachable, nasty breaking and offspeed pitches stop being rare gifts and become standard equipment — and a pitcher with three or four genuinely good non-fastballs has little reason to keep pumping heaters.
The velocity feedback loop
There is a paradox hiding in the numbers: even as the fastball’s share has fallen, the fastball itself has gotten faster. The two facts are connected. Pitchers throw fewer fastballs, but the ones they do throw are reserved for moments where pure velocity wins — the put-away pitch up in the zone, the count where a hitter is geared down for spin. Freed from having to live on the fastball, a pitcher can air it out on the ones he does throw.
That creates a feedback loop. Harder fastballs play better off sharp breaking balls, because the gap in speed and shape between a 99-mph four-seamer and an 84-mph sweeper is brutal to cover. The better the secondary stuff gets, the more selectively the fastball can be deployed; the more selectively it is deployed, the harder it can be thrown; the harder it is thrown, the nastier the contrast with the breaking ball. Fewer fastballs and faster fastballs are two outputs of the same optimization.
The hitter, meanwhile, is left guessing among a wider menu of better pitches, which is a large part of why bats are missing more often than ever. That outcome — the strikeout, the walk, the home run, the disappearing ball in play — is the subject of our piece on the three-true-outcomes takeover, and the shrinking fastball is one of its root causes.
The bottom line
The fastball is not going away — at 55.6% of all pitches in 2025 it remains, by a comfortable margin, the most-thrown pitch in baseball. But the trend line is unmistakable and the mechanism is well understood. Hitters punish straight pitches, pitch design has made breaking and offspeed pitches reliable enough to throw in any count, and the velocity loop rewards saving the fastball for the moments it wins outright. A 5.7-point drop from 61.3% to 55.6% in seven seasons does not sound seismic, but it represents a real inversion of how pitchers think: the fastball has gone from the thing you do by default to the thing you do on purpose.
Sources & Further Reading
- Free textbook: Chapter 11: Working with Dates, Times, and Time Series Data — the theory behind this, at DataField.dev.
- Pitch-usage data: Baseball Savant (pitch-arsenal leaderboard). Numbers retrieved June 2026; re-runnable via
scripts/fastball_usage.py. - FanGraphs — league-wide pitch-type usage and run values for cross-checking.
- MLB.com — Statcast pitch classifications and average velocity trends.