“.406.” “73 home runs.” Baseball’s record book sets these down as bare numbers, stripped of the run environment that produced them, and that bareness hides the most interesting part. The point was never that a player was good. It was that he was good in a season where almost nobody else was doing anything remotely like it.
So this is a list of ten seasons measured against their own leagues. The individual feats are famous historical records — you may already know them — but the point here is the gap between the player and everyone he shared a league with that year. That gap is what makes a season improbable, and a few of these gaps are absurd.
Why league context is the whole story
A .300 batting average meant something different in 1968 than it did in 1930, because the leagues those hitters lived in were different planets. The honest way to judge a season is to divide what the player did by what a typical player did in the same year — a ratio, not a raw total. A .406 average is impressive on its own; a .406 average in a league hitting .262 is something else entirely.
The table below does exactly that. For each feat it lists the value, the league context that season, and the multiple of league average the player reached. League-context figures come from the MLB Stats API; the records themselves are simply history. A note before you read it: two of the home-run rows compare a single hitter not to the league’s per-player rate but to an entire average team’s home-run output, which is a different and even more lopsided comparison. I’ll flag those when we get there.
| Player | Year | Stat | Value | League avg | vs. league |
|---|---|---|---|---|---|
| Ted Williams | 1941 | AVG | 0.406 | 0.262 | 1.55 |
| Babe Ruth | 1920 | HR | 54 | 39.4 | 1.37 |
| Bob Gibson | 1968 | ERA | 1.12 | 2.98 | 2.66 |
| Barry Bonds | 2001 | HR | 73 | 181.9 | 0.4 |
| Barry Bonds | 2004 | OBP | 0.609 | 0.335 | 1.82 |
| Barry Bonds | 2001 | SLG | 0.863 | 0.427 | 2.02 |
| Hack Wilson | 1930 | RBI | 191 | 0.296 | None |
| Pedro Martinez | 2000 | ERA | 1.74 | 4.77 | 2.74 |
| Aaron Judge | 2022 | HR | 62 | 173.8 | 0.36 |
| Dwight Gooden | 1985 | ERA | 1.53 | 3.89 | 2.54 |
The contact merchants: Williams and the .406 ceiling
Ted Williams hit .406 in 1941, and no one has reached .400 since. The number that makes it improbable is the company it kept: the league batted .262 that year, so Williams was running about 1.55 times the league average. Translate that to a modern environment and you are talking about a hitter clearing .380 in a league that hits .245 — a thing that simply does not happen anymore. Williams did it while walking 147 times, which means pitchers were actively avoiding him and he hit .406 anyway.
The .406 is celebrated as a contact feat, and it was, but the league-relative version is the part that has aged into myth. Hitting is harder than it was, defenses are better positioned, and pitchers throw harder; a 1.55x batting-average season is now closer to physically impossible than merely rare.
The power outliers: out-homering entire teams
Babe Ruth hit 54 home runs in 1920. The improbable part is not the 54 — it is that the average team that season hit about 39.4 home runs total. Ruth, by himself, out-homered a typical roster of his peers by a factor of roughly 1.37. One man produced more long balls than nine other men combined, in a sport where the home run was still treated as a novelty. No statistic in this article better captures a single player dragging the whole game in a new direction.
The modern single-season records make a useful contrast, and they are the subject of the figure below. When Barry Bonds hit 73 home runs in 2001, the average team hit about 181.9 — so Bonds’s personal total came to roughly 0.4 of a full team’s output, not the 1.37 Ruth posted. Aaron Judge’s 62 in 2022 landed near 0.36 of the average team’s 173.8. Those are staggering individual seasons, but the league had caught up to the idea of the home run; nobody in the live-ball era out-homers whole rosters anymore, because every roster is now full of people trying to do the same thing.
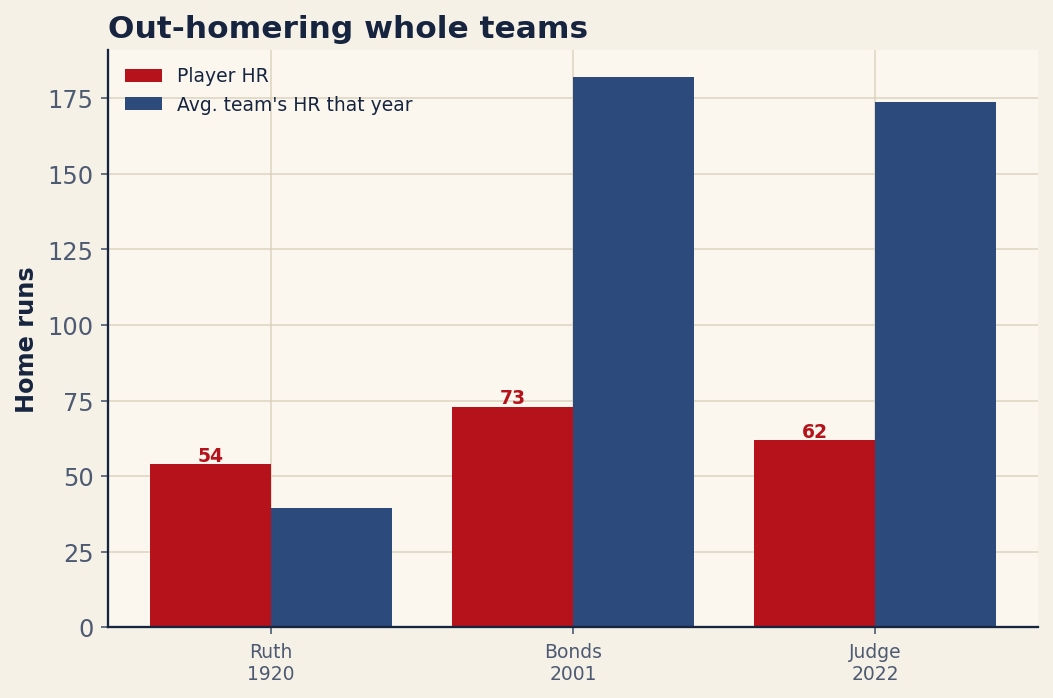
That is the quiet lesson of the chart: Ruth’s bar towers over its league not because he hit the most home runs ever — he didn’t — but because his league hit so few. Improbability is a ratio, and Ruth’s denominator was tiny.
Bonds in a category of one
Bonds shows up three times here, which is itself a kind of evidence. His 2004 on-base percentage was .609 against a league mark of .335 — about 1.82 times league average, a season in which he reached base more often than he made an out by a comfortable margin. His 2001 slugging percentage of .863 ran roughly 2.02 times the league’s .427. An on-base feat and a slugging feat, each roughly double the league, in overlapping seasons, from the same player. Whatever you make of the era, the league-relative distance is unmatched on the offensive side of this list.
The OBP figure is the one I find hardest to wrap my head around. Reaching base in well over half your plate appearances, in a league where the average hitter does it about a third of the time, means opposing managers had essentially decided that letting Bonds hit was the larger of two evils — and he still posted the highest on-base season on record.
The Year of the Pitcher and its heirs
Pitching has its own improbable seasons, and the ratios get even more extreme because run prevention scales differently. Bob Gibson’s 1.12 ERA in 1968 came in a league that posted a 2.98 ERA — Gibson was about 2.66 times better than his league at preventing runs, in the lowest-scoring season of the modern era. 1968 was so pitching-dominated that the sport lowered the mound the following winter, which makes Gibson’s mark a record that the rulebook itself reacted to.
What I find more improbable still is doing it when the league is hitting. Pedro Martinez ran a 1.74 ERA in 2000, when the league ERA was a balmy 4.77 — roughly 2.74 times better than his environment, in the thick of the highest-offense era baseball has seen. Gibson was excellent in a graveyard for hitters; Pedro was excellent in a launching pad, which is the harder trick. Dwight Gooden’s 1985, a 1.53 ERA against a 3.89 league mark, sits at about 2.54 times league — a 20-year-old turning in one of the great age-relative seasons on record.
The counting-stat monument: Hack Wilson’s 191
Hack Wilson drove in 191 runs in 1930, a record that has stood for nearly a century and almost certainly always will. I am deliberately not assigning it a league multiple, because runs batted in depend as much on the hitters in front of you as on your own bat, and the clean league baseline for it isn’t the kind of apples-to-apples ratio the rest of this list uses. What I can say is the context: 1930 was the single most offense-soaked season of the live-ball era, a year when the entire National League hit .303. Wilson’s 191 was a monument built at the exact moment conditions were most favorable to building it — and no one has come within 25 of it since, even in seasons just as offensive.
The bottom line
Improbability is not the same as greatness, and it is not the same as a big number. It is distance from your peers. Williams’s .406 and Ruth’s 54 endure because their leagues were so far below them; Gibson’s and Pedro’s ERAs endure because run prevention at that level, in those environments, is nearly off the chart. Read the record book with the league printed next to every line and the famous seasons stop being trivia and start being measurements — of just how far one player can pull away from everyone else who showed up that year. If this is the kind of thing you like, the same league-relative thinking powers stats like wRC+ and OPS+, which do it for every player, every season, automatically.
Sources & Further Reading
- League-context figures: MLB.com (MLB Stats API historical league totals). Retrieved June 2026; re-runnable via
scripts/improbable_seasons.py. - Baseball-Reference — single-season leaderboards and the historical record book.
- SABR — biographical and historical context for the seasons above.