Four times over the last decade, MLB sold the same city two tickets to the same summer. New York had the Yankees and the Mets, Los Angeles the Dodgers and the Angels, Chicago the Cubs and the White Sox, and the Bay Area the Giants and the Athletics — eight clubs, four shared markets, presumably selling to the same fans. Intuition offers two stories about what sharing a town should do to two baseball teams. The cozy one: shared market, shared money, shared fate — big-city pairs should rise together. The dramatic one: a city is a zero-sum stage, and one club’s golden era starves the other. Both stories are testable, because the site’s bundle carries every final record from 2015 through 2024, and both stories, it turns out, are wrong.
Here is what the standings actually say. Across the nine full seasons in that window (2020’s 60-game sprint is omitted throughout), the average gap between two clubs sharing a market was 19.4 wins per 162. The average gap between two MLB clubs chosen at random in the same season was 15.0. Your crosstown “rival” was not your mirror, and not your anchor — it was a stranger who happened to park in the same lot. Correlation between market-mates’ winning percentages: statistically zero, and pointing slightly down.
What counts, and how it’s measured
A shared market here means the four metro areas that carried two clubs for the whole 2015–2024 window — the same four pairings MLB itself treats as two-team territories. Yes, the Angels play in Anaheim and stopped being literally “of Los Angeles” sometime around their fourth rebrand; they market to the same region, so they count. Every pair, conveniently, is one AL club and one NL club, which means none of these teams ever chased the same division title — whatever pushes them together or apart, it isn’t a direct standings duel.
The yardstick is deliberately boring. For each pair-season we take both final records from the bundled standings file, recompute winning percentage from wins and losses, and price the difference in wins per 162:
Worked example, the ugliest one available. In 2024 the Cubs went 83–79, a .512 winning percentage; the White Sox went 41–121, a .253 winning percentage that set the modern-era loss record. The gap is .259 × 162 = 42.0 wins — two teams, one town, and a 42-win canyon on the L. The same arithmetic runs for all 36 pair-seasons, and for a baseline: every one of the 3,915 possible same-season pairings of the league’s 30 clubs over those nine years. The baseline is the whole trick — “do crosstown teams move together?” means nothing except relative to how much any two teams resemble each other, and a league whose records spread 12–16 wins around .500 sets that bar high.
Farther apart than strangers
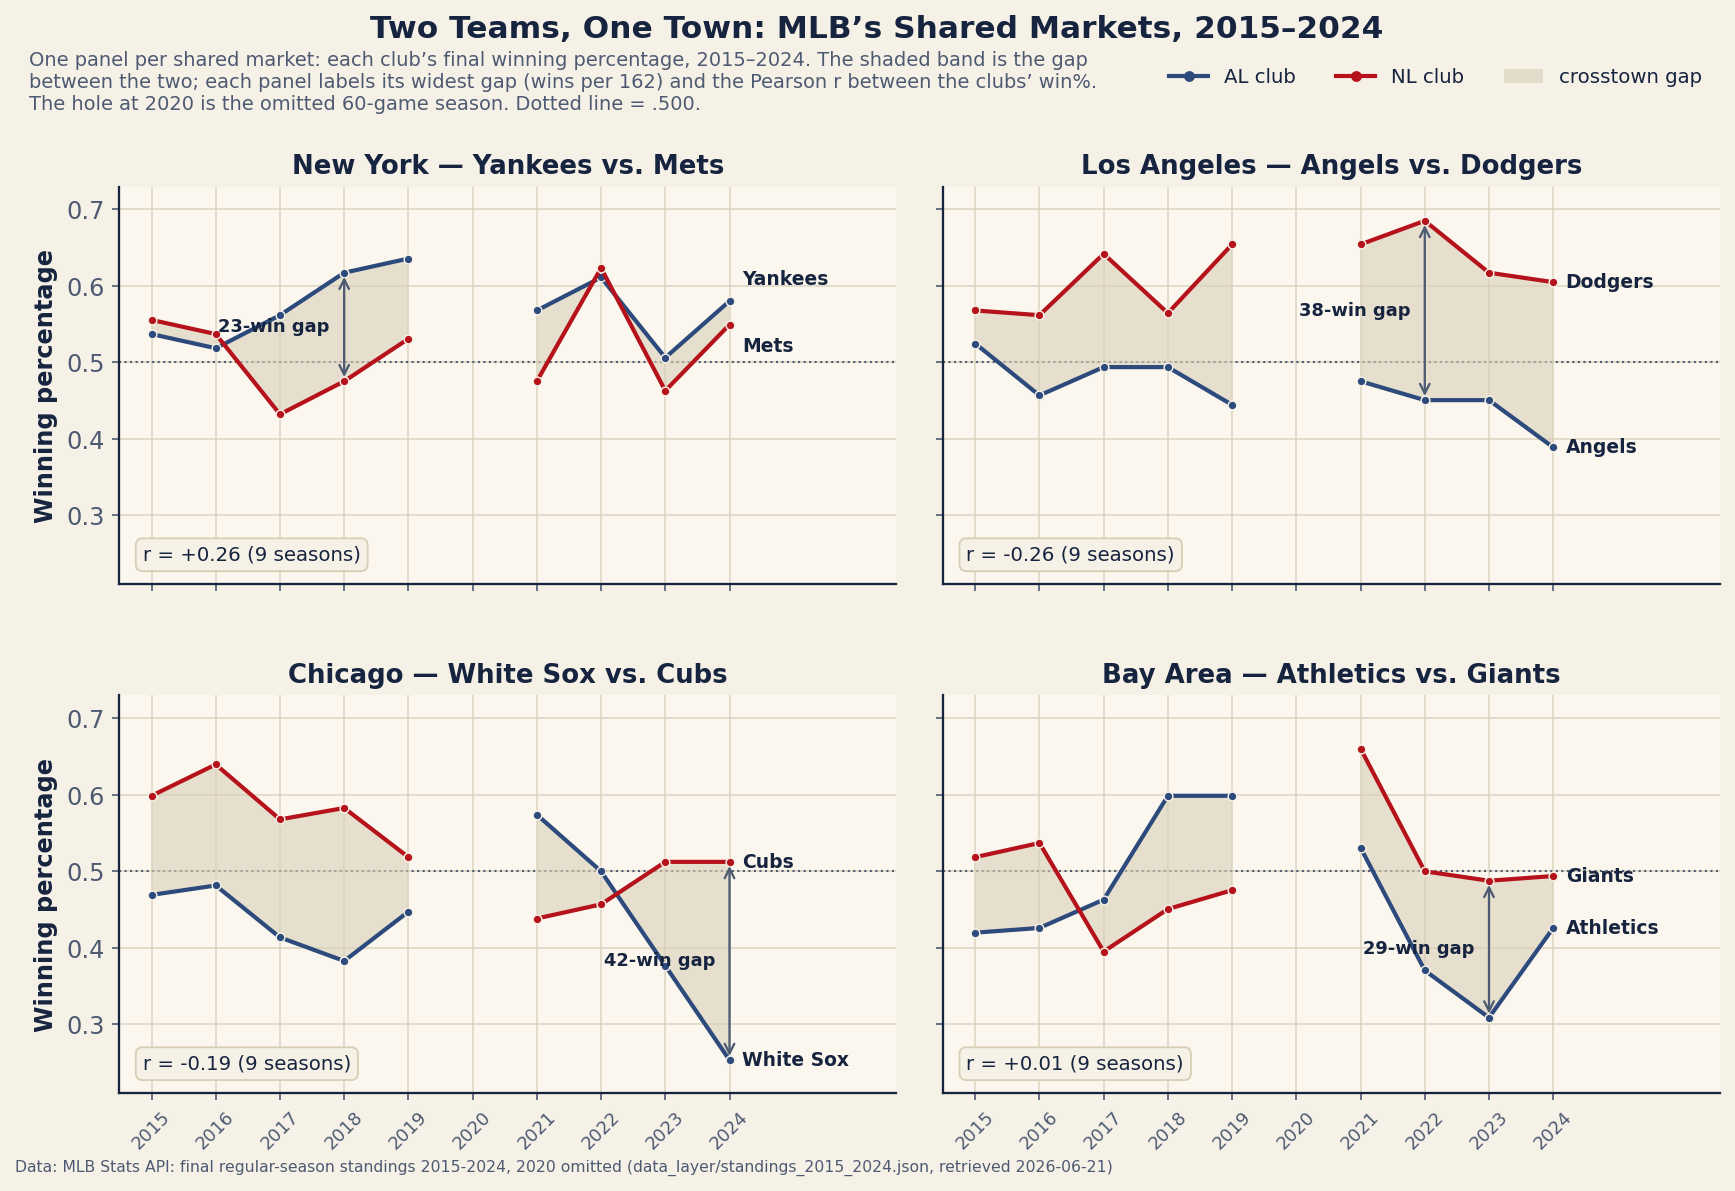
data_layer/standings_2015_2024.json (retrieved 2026-06-21), charted by charts/chart_market_pairs.py.Read the bands, not the lines. New York is the only market where the band stays thin — a 10.7-win average gap, the sole pair that spent most of the decade on the same side of .500. The other three markets averaged 24.7 (Los Angeles), 23.2 (Chicago), and 19.0 (Bay Area) wins of daylight, and the league’s random-pair baseline of 15.0 splits New York from everyone else. Put differently: about 30% of all random same-season pairings in this window were 19.4 or more wins apart — the average crosstown pairing lived in the league’s wide-gap tail, not near its middle.
The individual gaps are the decade’s best trivia. The widest is Chicago 2024’s 42; second is Los Angeles 2022, where the Dodgers won 111 games and the Angels — employing, it should be noted, two of the era’s inner-circle talents — lost 89, a 38-win gap inside one freeway system. Los Angeles owns three of the decade’s four biggest crosstown gaps (38 in 2022, 35 in 2024, 34 in 2019); the Dodgers finished with the better record all nine seasons, 900–559 (.617) to the Angels’ 677–781 (.464). That is not a rivalry, it’s a control group.
Sharing a town is not sharing a fate
Now the correlation question, asked honestly. Nine seasons per pair is a tiny sample, so the confidence intervals arrive first: New York’s market-mates correlate at r = +0.26 (95% CI [−0.49, +0.79]), Los Angeles at −0.26 [−0.79, +0.48], Chicago at −0.19 [−0.76, +0.54], the Bay at +0.01 [−0.66, +0.67]. Every interval swallows zero whole. Pool all 36 pair-seasons (double-entered, since neither club is meaningfully “first”) and the combined figure lands at −0.24 — a lean toward anti-correlation that the sample size cannot begin to certify. The defensible reading: no detectable link, cozy story dead, and the dramatic zero-sum story unproven at best.
For scale: a club’s own previous season predicts its next one at r = +0.54. Your own roster, one year older, tells you five times more than the team across town is telling you right now — actually more than that, since +0.54 is at least distinguishable from noise and −0.24 on this sample is not. Whatever a shared market shares — media money, weather, traffic — it does not detectably share wins. Front offices, payroll cycles, and farm systems are franchise-level machinery, and each franchise runs its own boom-and-bust clock.
Winning together is a New York habit
Both clubs in a market finished over .500 in the same season just 7 times in 36 tries, and the distribution is a punchline: five of the seven are New York’s (2015, 2016, 2019, 2022, 2024), the sixth is Los Angeles in 2015 — the only time the Angels out-ran .500 in the whole window — and the seventh is the Bay in 2021, when the Giants won 107 and the A’s quietly won 86. The only season in nine years where two market-mates both reached 90 wins is New York 2022: Yankees 99–63, Mets 101–61, the full two-ticket October the other cities never printed. Chicago went 0-for-9 — at no point in this window did the Cubs and White Sox both finish over .500. The nearest miss: 2022, when the White Sox landed on 81–81, exactly .500 — joined, that same season, by the 81–81 Giants.
Both clubs finishing under .500 together happened only three times, and every one belongs to the Bay Area (2017, 2023, 2024) — the lone market that managed shared misery, right before it stopped being a shared market at all. And within each pair, one club mostly owned the town: the Yankees took the better record 6 seasons to 3 over the Mets, the Cubs 7–2 over the White Sox, the Giants 6–3 over the A’s, and the Dodgers, again, 9–0. Half of these “rivalries” were monologues.
The big-market premium is two franchises deep
The eight shared-market clubs did out-play the field — barely. Collectively they went 5,977–5,687 (.512) across the window while the other 22 clubs went .495, a premium of about three wins per 162. But the premium has a shape. Remove the Yankees (832–626, .571) and the Dodgers (900–559, .617) and the remaining six two-team-market clubs played .485 baseball — worse than the rest of the league. By market: New York combined hit .543 and Los Angeles .541, while Chicago (.485) and the Bay (.481) both spent the decade under water as metro areas. The “big-market advantage” of the shared cities is real in aggregate and almost entirely a two-franchise phenomenon; the Mets (.516), Cubs (.536), and Giants (.502) hovered near the middle, and the Angels (.464), A’s (.460), and White Sox (.433) spent the decade proving a top-five media market buys you nothing by itself.
2026: three pairs left, same physics
The four-market era is over — the A’s played their last Oakland season in 2024 and have been playing in West Sacramento since 2025 while their Las Vegas park goes up — so the live season carries only three shared markets. Per the bundled 2026 standings snapshot (mlb_2026_standings_2026-08-02.json, MLB Stats API, retrieved 2026-08-02, with clubs at 110–112 games — a partial-season read, not a verdict), the physics look familiar. New York: Yankees 62–49 (.559), Mets 47–65 (.420), a 22.5-win gap at full-season pace — wider than anything the pair produced in the bundled decade except 2018’s 23. Los Angeles: Dodgers 69–42 (.622), Angels 42–69 (.378) — a mirror-image record and a 39.4-win pace gap that would beat the decade’s record 38, set by the same two teams. The market keeps not mattering.
Chicago is the counterpoint worth watching. The White Sox — 41–121 two seasons ago — sit 58–52 (.527) and, per the snapshot, on top of their division, with the Cubs at 63–48 (.568). That is a 6.5-win pace gap, narrower than any Chicago season in the bundle (the closest was 7.0, in 2022), and if both clubs hold above .500 through September it would be the market’s first double-winning season in at least a decade. The dissolved pair, meanwhile, is finally converging: the Giants (47–64) and the Athletics (45–66) are two games apart — now that they’re 80 miles from being neighbors. Where the partial records go from here is the live season’s problem; the snapshot’s point is that all three surviving markets are running gaps, not partnerships.
Limitations, stated plainly
Six of them. First, the samples are tiny: nine seasons per pair, 36 pair-seasons total, and the four pairs share seasons with each other, so they are not independent draws; every correlation here is descriptive, none is a law. Second, the random-pair baseline includes same-division pairs, whose head-to-head games mechanically push records apart — but excluding that does not rescue the cozy story: restrict the baseline to cross-league pairs (the honest comparison, since every market pair is AL–NL) and it moves from 15.0 to 14.9, while same-division pairs average 15.9. Third, “market” is a fuzzy noun — the Angels are 30-odd miles from Dodger Stadium, and a metro area is not one economy. Fourth, this piece measures no money: the bundle carries standings, not payrolls, so “the market doesn’t buy wins” is an inference from records, not an audit of budgets. Fifth, 2020 is omitted (a 60-game season priced in per-162 units would be noise wearing a costume), so “the decade” is really nine seasons. Sixth, winning percentage is recomputed from W and L, and the few 161- and 163-game seasons are normalized by the ×162 pricing; rerun it on raw wins and nothing changes at the quoted precision.
The bottom line
Over 2015–2024, sharing a city bought MLB fans almost nothing jointly: crosstown pairs finished an average of 19.4 wins apart — four and a half more than random strangers — correlated at a pooled −0.24 that rounds honestly to zero, won together in 7 of 36 seasons (mostly in one borough-rich market), and delivered exactly one two-ticket 90-win October in nine years. The city is a billing address. The franchise is the machine. If you want to know where a team is going, look at its own last season, its run differential, and how hard .500 pulls on everyone — and spare exactly one glance for the team across town, which is, statistically speaking, just another opponent with better parking stories.
Reproduce it
The standings file ships in the site’s data_layer/ (provenance in data_layer/SOURCE.txt), and the whole argument is a few loops:
import json, itertools, statistics as st

D = json.load(open("data_layer/standings_2015_2024.json", encoding="utf-8"))
T = {(t["season"], t["name"]): t for t in D["teams"]}
wp = lambda t: t["W"] / (t["W"] + t["L"])

PAIRS = [("Yankees", "Mets"), ("Angels", "Dodgers"),
         ("White Sox", "Cubs"), ("Athletics", "Giants")]

market = [abs(wp(T[(s, a)]) - wp(T[(s, b)])) * 162
          for a, b in PAIRS for s in D["seasons"]]

league = [abs(wp(a) - wp(b)) * 162
          for s in D["seasons"]
          for a, b in itertools.combinations(
              [t for t in D["teams"] if t["season"] == s], 2)]

print("market pairs: %.1f wins apart on average (n=%d)"
      % (st.mean(market), len(market)))
print("random pairs: %.1f wins apart on average (n=%d)"
      % (st.mean(league), len(league)))

# output:
#   market pairs: 19.4 wins apart on average (n=36)
#   random pairs: 15.0 wins apart on average (n=3915)
The four-panel exhibit is charts/chart_market_pairs.py: it reads only the bundled JSON, recomputes every winning percentage from W and L, picks each panel’s labeled gap by computed maximum, and prints the per-pair correlations it draws. The confidence intervals in the text are standard Fisher-z intervals with n = 9; the pooled figure double-enters each pair-season, the usual treatment for unordered pairs.
Sources & Further Reading
- Final regular-season standings 2015–2024: MLB Stats API, bundled as
data_layer/standings_2015_2024.json(retrieved 2026-06-21); 2026 snapshot from the same source, bundled asdata_layer/mlb_2026_standings_2026-08-02.json— a frozen, dated copy of the live standings file, served alongside it so these figures stay checkable after the next refresh (retrieved 2026-08-02), charted bycharts/chart_market_pairs.py. - Historical cross-checks on franchise records and the 2024 White Sox loss record: Baseball-Reference.
- The neighboring pieces this one leans on: MLB’s most and least consistent franchises and competitive balance, 2015–2024.