This site has circled the question three times without ever asking it straight. One piece ranked the hitting stats against each other and crowned OBP; another found the pitching stat that travels and clocked it at +0.70 against winning; a third asked whether offense or defense won 2023 and answered with the runs columns. What none of them did is put the two sides of the ball in the same frame, same season, same yardstick: take each 2024 club’s hitting line and its pitching line, correlate both with winning percentage across all 30 teams, and see which side of the stat page the standings actually live on. So that’s this piece. Best batting aggregate in the bundle: team OPS. Best pitching aggregate: team ERA. Head to head.
The result reads clean and resolves nothing, which is exactly why it’s worth writing down carefully. In 2024 the bats tracked winning at r = +0.79 and the arms at r = −0.74 — hitting edged pitching, flipping the verdict the 2023 runs-based version of this question returned a year earlier. But run the honest test on that gap and it dissolves: with 30 teams, a 0.79-versus-0.74 difference is statistically nothing (p = 0.62). The real finding is sitting one layer down. The two sides are nearly independent of each other across clubs, and together, two numbers off the back of a team’s stat page — OPS and ERA — explain 91% of the variance in 2024 winning percentage. You can very nearly reconstruct a season’s standings without ever looking at the standings.
What this asks that the earlier pieces didn’t
Three neighbors on this site, and the empty lane between them. Which hitting stat predicts wins? ranked the batting family internally — OBP and OPS at 0.79, slugging 0.75, batting average last at 0.62 — and closed by noting that even the best hitting stat “caps out around 0.79 because pitching and defense decide the rest.” This article is that sentence, measured. The K-BB% piece did the pitching side’s internal audit and found the skill-purest staff rate correlates with win% at +0.70. And the 2023 offense-or-defense piece asked the sides question with runs scored and runs allowed — the outcomes each side produces — not the stat lines themselves.
Runs and stat lines are different questions. A team’s runs-scored total already has sequencing and cluster luck baked in; its OPS is closer to the raw material. Same on the other side: runs allowed includes the defense’s errors and the bullpen’s timing, while ERA is the staff’s conventional summary number. Asking “which side’s stat line tracks winning” is asking what you can read off a team page in March… well, October — without touching the runs columns at all. For 2024 the bundle carries both halves: team batting (AVG/OBP/SLG/OPS/HR/runs) and team pitching (K/BB/BF/IP/ERA/runs allowed), each joined to the final record, joined to each other on team_id.
The head-to-head
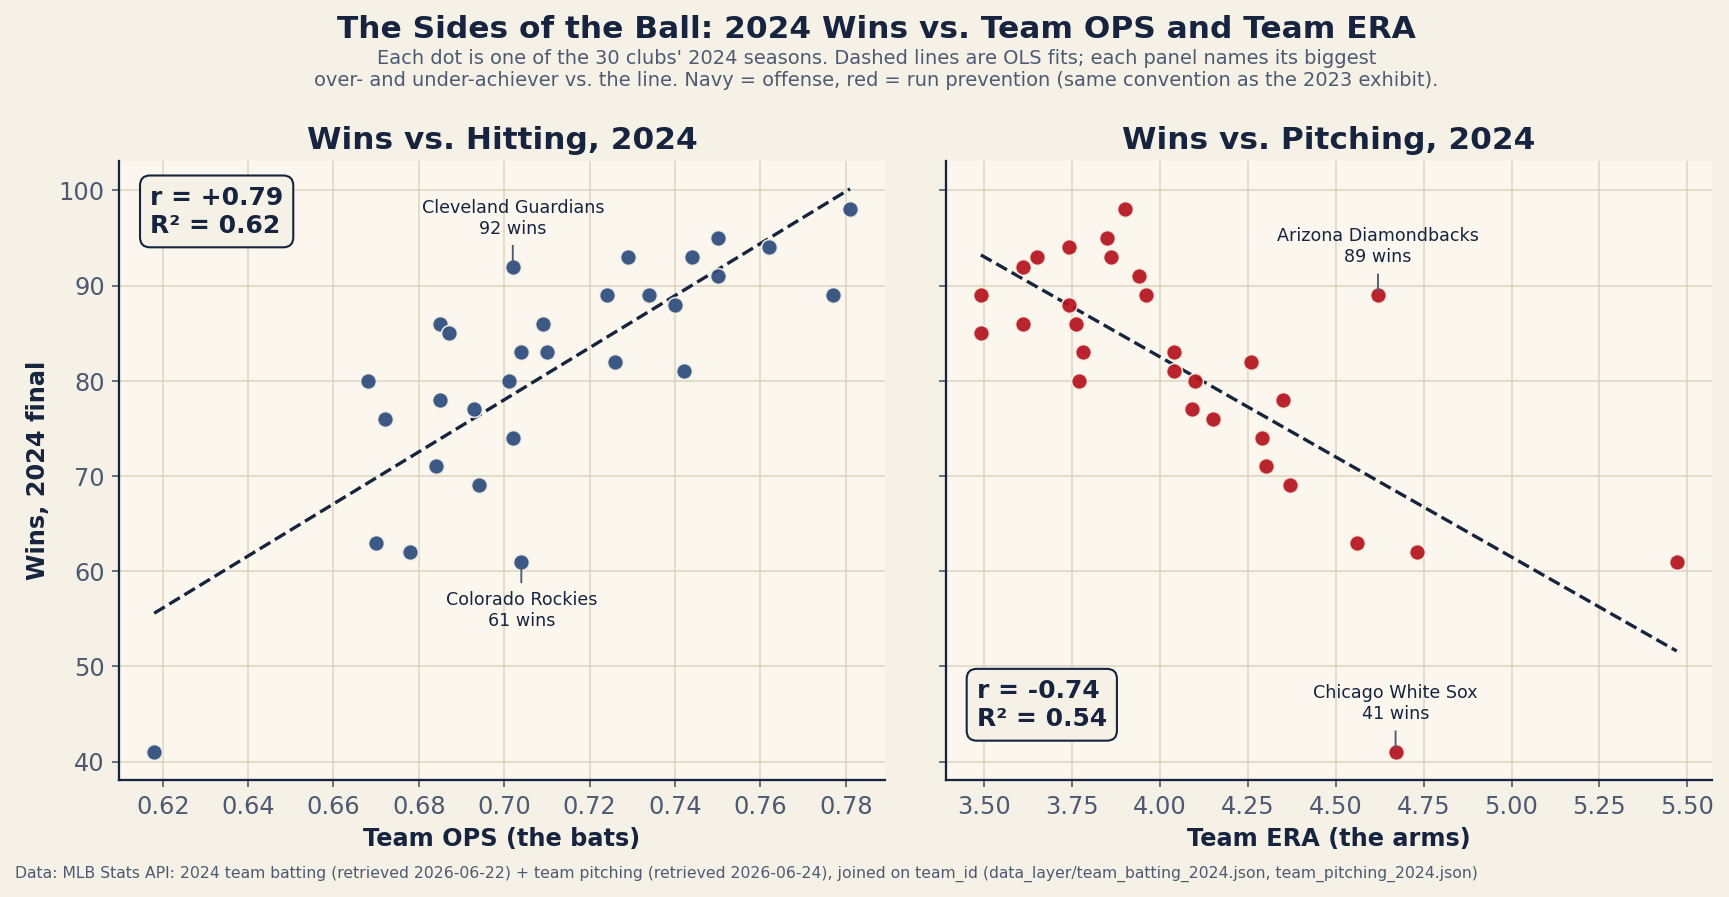
data_layer/team_batting_2024.json and team_pitching_2024.json, charted by charts/chart_hitting_vs_pitching.py.The left cloud hugs its line a touch tighter than the right one: OPS correlates with 2024 winning percentage at +0.79 (R² = 0.62), ERA at −0.74 (R² = 0.54). The result is not an artifact of which aggregate we picked for each side. On the batting side, OBP alone lands in the same place as OPS (+0.79). On the pitching side, swapping ERA for total runs allowed — which adds back the unearned runs ERA politely ignores — barely moves the needle, −0.75, so this isn’t the earned/unearned bookkeeping deciding the contest; and the skill-purer K-BB% comes in at +0.70. Every reasonable pitching aggregate in the file trails every reasonable on-base-inclusive batting aggregate. In 2024, the standings were a little easier to read off the hitting line.
2023 said pitching. 2024 said hitting. Neither said much.
Now the part that stops the takeaway from becoming a slogan. The 2023 piece ran the runs-based version and found run prevention ahead: wins correlated with runs allowed at −0.82 and with runs scored at +0.78 (both recomputed here from the bundled 2023 standings; they check out). It warned, four hundredths being four hundredths, that another season might flip it. 2024 flipped it. Runs scored correlated with win% at +0.81, runs allowed at −0.75 — offense ahead this time, by more than 2023’s margin — and the stat-line version you’re reading (+0.79 vs −0.74) agrees with the sign of the flip.
And the honest statistics say: of course it flipped, because the gap was never real. The right tool here is Steiger’s test for comparing two dependent correlations — dependent because both are correlations with the same 30 winning percentages. For 2024’s +0.787 (OPS) versus −0.737 (ERA): z = 0.49, two-sided p = 0.62. The 95% confidence interval on the OPS correlation is [+0.60, +0.89]; on the ERA correlation, [−0.87, −0.51]. Those intervals don’t just overlap, they nearly coincide in magnitude. Thirty data points can establish that both sides of the ball matter enormously; they cannot rank the two sides, and any season that appears to — 2023 one way, 2024 the other — is showing you sampling noise wearing a narrative. We checked one tempting mechanical explanation and it isn’t there either: the spreads were nearly symmetric both years (standard deviation of runs scored vs. allowed: 74.2 vs 72.3 in 2024, 81.5 vs 80.8 in 2023). The coin just landed differently.
The teams that broke their side’s line
The scatter is where the season’s characters live, and 2024 supplied a full cast. The Diamondbacks are the chart’s great lopsided team: the league’s second-best offense (.777 OPS, behind only the Dodgers’ .781) bolted to its fourth-worst staff (4.62 ERA) — and the offense won the argument, 89 wins, 19.5 wins above what the ERA line alone would price them at. Their mirror image is the Mariners: tied with the Braves for the best ERA in baseball (3.49) while the lineup managed a .687 OPS, 24th of 30 — and they got 85 wins, the pitching dragging the offense to respectability but no further. One team all bats, one team all arms; the bats bought more.
The Guardians are the left panel’s biggest over-achiever — 92 wins carrying a .702 OPS, 13 wins above the hitting line, though calling it a mystery would be generous: they also had the third-best ERA (3.61), which is rather the point of having two panels. The Rockies under-ran their .704 OPS by 18 wins, partly because Coors Field inflates the OPS without inflating the team, and partly because of a 5.47 ERA you could see from Denver. And the White Sox broke both panels at once: the worst OPS in the file (.618) and a bottom-three ERA (4.67), and they still managed to land 27 wins below what even that staff implied. A 41–121 season requires failing the stat line and then failing beneath it.
Two numbers, 91% of the standings
Here’s the finding we’d actually carry out of 2024. Across the 30 clubs, team OPS and team ERA are barely correlated with each other (r = 0.28 after flipping ERA’s sign) — being good at one side says almost nothing about being good at the other. Nearly independent inputs mean their information adds. Fit the two-variable regression and:
That model explains 91.1% of the variance in 2024 winning percentage, with a typical miss of 3.7 wins per 162. The runs columns — run differential, the engine under the Pythagorean table this site built in Python — correlate with win% at 0.965, R² = 0.93. So the stat line gets you to 91% and the actual runs ledger only adds about two points more. The coefficients even hand you an exchange rate: 50 points of team OPS ≈ 11.0 wins, half a run of team ERA ≈ 8.0 wins — or, at market par, about 73 points of OPS buys the same standings movement as a full run of ERA, in this one season’s prices.
Worked example, best team first. The Dodgers hit .781 OPS with a 3.90 ERA: −0.059 + 1.355 × 0.781 − 0.099 × 3.90 = .612, which is 99.2 wins over 162. They won 98. The model’s worst customer is, again, Chicago: .618 and 4.67 price out at 51 wins, and the White Sox delivered 41 — ten wins below even their own dreadful inputs, the residual where the sequencing, the bullpen timing, and whatever else happened on the South Side all live.
Limitations, stated plainly
Five of them. First, n = 30, one season — the whole middle section of this piece is a warning label, and it applies to our own headline too: “hitting edged pitching in 2024” is a description of one sample, not a law. Second, correlation isn’t causation: good organizations buy hitting, pitching, and wins out of the same budget, so all three share a common cause. Third, neither input is park-adjusted — Coors hands the Rockies a flattering OPS and a damning ERA at once, which is exactly the distortion park factors exist to remove; we used the raw versions because that’s what the bundle carries and what a fan reads first. Fourth, OPS and ERA are themselves season outcomes, not pure skills — ERA in particular launders defense and luck, which is why its skill-purer cousin K-BB% runs lower (+0.70) against winning. Fifth, a bookkeeping note: two clubs (the Astros and Guardians) played 161 games in 2024, so all correlations here use winning percentage rather than raw wins; rerun everything on win totals and nothing changes at the precision quoted.
The bottom line
Asked to pick a winner between the bats and the arms, 2024 leaned hitting, +0.79 to −0.74 — and the year before leaned the other way, and the test says the lean is noise both times. The durable result is the one the two panels make together: the sides of the ball are close to independent, close to equally weighted, and jointly they are the standings, to 91%. Don’t ask which side of the stat page wins. Read both sides, add them up, and you’ve already priced the season to within four wins a team — everything after that is the good part, the part the stat line can’t see.
Reproduce it
Both files ship in the site’s data_layer/ (provenance for every bundled file is logged in data_layer/SOURCE.txt), and the head-to-head is a dozen lines:
import json, math, statistics as st

def teams(path):
    return {t["team_id"]: t for t in json.load(open(path, encoding="utf-8"))["teams"]}

def corr(xs, ys):
    mx, my = st.mean(xs), st.mean(ys)
    return (sum((x - mx) * (y - my) for x, y in zip(xs, ys))
            / math.sqrt(sum((x - mx) ** 2 for x in xs)
                        * sum((y - my) ** 2 for y in ys)))

B = teams("data_layer/team_batting_2024.json")
P = teams("data_layer/team_pitching_2024.json")
rows = [(B[i], P[i]) for i in sorted(B)]          # join on team_id
wp = [b["winpct"] for b, p in rows]

for label, vals in [("OPS ", [b["OPS"] for b, p in rows]),
                    ("ERA ", [p["ERA"] for b, p in rows]),
                    ("diff", [b["runs"] - p["runs_allowed"] for b, p in rows])]:
    r = corr(vals, wp)
    print(label, "r = %+.3f   r^2 = %.2f" % (r, r * r))

# output:
#   OPS  r = +0.787   r^2 = 0.62
#   ERA  r = -0.737   r^2 = 0.54
#   diff r = +0.965   r^2 = 0.93
The two-panel exhibit is charts/chart_hitting_vs_pitching.py; it reads only the two JSONs, refits both lines, and picks the labeled outliers by computed residual at run time. The Steiger z and the confidence intervals follow the standard formulas (Fisher z with n = 30) on the correlations above.
Sources & Further Reading
- 2024 team batting and team pitching, each joined to final standings: MLB Stats API, bundled as
data_layer/team_batting_2024.json(retrieved 2026-06-22) anddata_layer/team_pitching_2024.json(retrieved 2026-06-24), charted bycharts/chart_hitting_vs_pitching.py. - 2023 comparison figures recomputed from the bundled
data_layer/standings_2023.csv(Baseball-Reference), the same file behind the runs-based 2023 verdict. - The two internal audits this piece completes: which hitting stat predicts wins and K-BB%, the pitching stat that travels.