Go look up your favorite star’s Wins Above Replacement right now, and then look it up somewhere else, and watch the number change underneath you. Baseball-Reference says 6.0 wins. FanGraphs says 5.2. Or 6.7. Same player, same season, the exact same 162 games — and the one number that’s supposed to end the MVP argument can’t even agree with itself. I get why this drives newcomers up the wall; it feels like somebody forgot to carry a decimal somewhere.
Nobody forgot anything. WAR isn’t a counted quantity like a home run total — it’s an estimate, stacked on a chain of smaller estimates, and the two big public versions (Baseball-Reference’s bWAR and FanGraphs’ fWAR) make different but entirely defensible calls at a few links in that chain. Knowing where those calls happen is the whole difference between using WAR and just brandishing it in an argument.
What both versions agree on
Start with the common ground, because it is larger than the arguments suggest. Both bWAR and fWAR answer the same question: how many wins did this player add compared to a freely available “replacement-level” player — a quad-A call-up, a waiver-wire flier — given his offense, defense, baserunning, and position? Both express the answer in wins. Both set replacement level at the same place: a team of pure replacement players would win about 29 percent of its games, a roughly .294 win percentage, which works out near 48 wins over a full season. Both convert runs to wins at approximately ten runs per win.
That alignment didn’t fall out of the sky — it’s a deliberate truce. Years back the two sites ran different replacement baselines, which baked in a gap before anyone evaluated a single play. They sat down and standardized the framework, so that structural disagreement is mostly history now. What’s left is the genuinely hard part, the part no truce can settle: estimating the run values themselves.
The 2025 leaderboard, by component
Here is what bWAR looks like broken into its pieces. The figure shows the 2025 Baseball-Reference leaders split into their offensive and defensive/positional contributions, and the table lists the same players with the exact values.
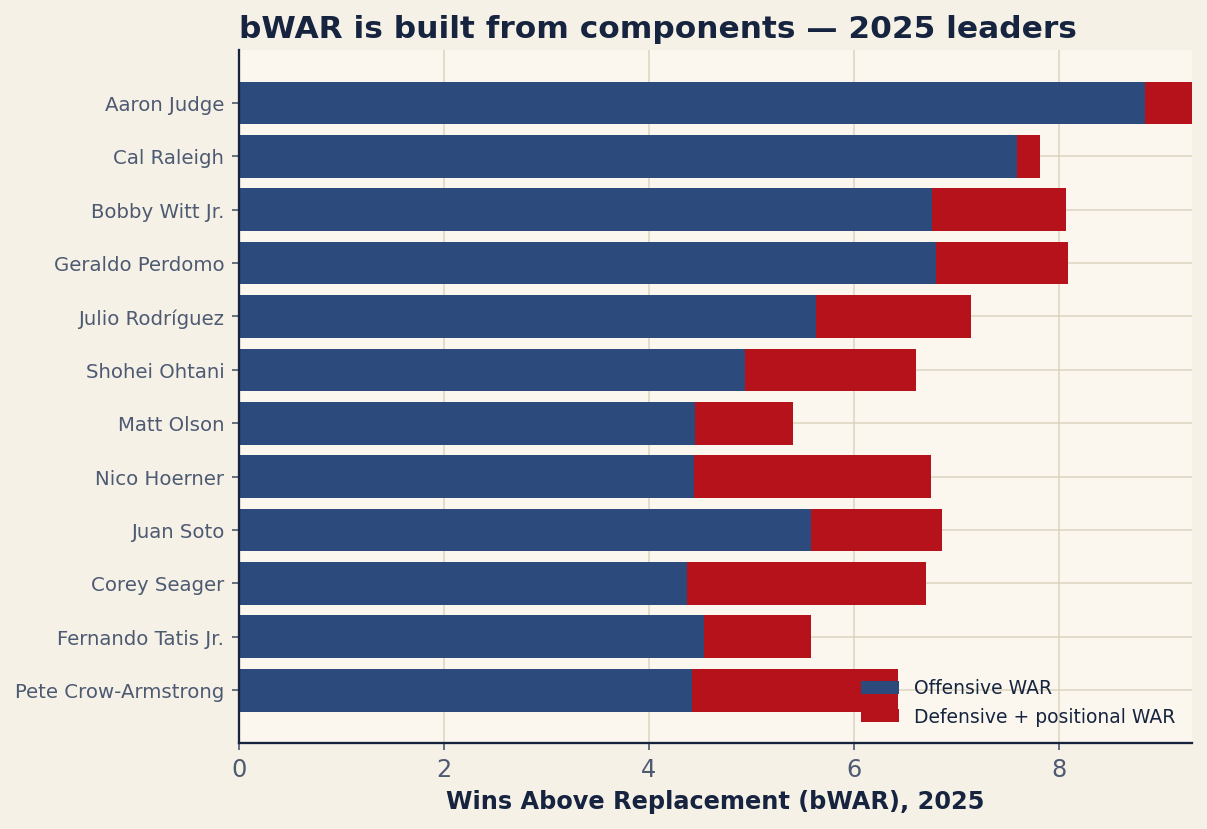
Aaron Judge ran away with it at 9.7 bWAR, and the split tells you why: 9.3 of that came from his bat, with defense a slight −0.5 drag. Judge is a hitting machine first and a fielder second, and the components say so plainly. Behind him, Cal Raleigh posted 7.2 — 7.6 on offense, a small positive on defense — a monster line for a catcher. Then a near-tie at the top of the field: Bobby Witt Jr. and Geraldo Perdomo both at 7.1, each pairing strong offense with a healthy +1.3 on defense.
| Player | bWAR | Off WAR | Def WAR |
|---|---|---|---|
| Aaron Judge | 9.7 | 9.3 | -0.5 |
| Cal Raleigh | 7.2 | 7.6 | 0.2 |
| Bobby Witt Jr. | 7.1 | 6.8 | 1.3 |
| Geraldo Perdomo | 7.1 | 6.8 | 1.3 |
| Julio Rodríguez | 6.6 | 5.6 | 1.5 |
| Shohei Ohtani | 6.6 | 6.6 | -1.7 |
| Matt Olson | 6.2 | 4.5 | 1.0 |
| Nico Hoerner | 6.2 | 4.4 | 2.3 |
| Juan Soto | 6.1 | 6.9 | -1.3 |
| Corey Seager | 6.1 | 4.4 | 2.3 |
| Fernando Tatis Jr. | 6.1 | 4.5 | 1.0 |
| Pete Crow-Armstrong | 5.9 | 4.4 | 2.0 |
Run your eye down the defensive column and the moral writes itself. Nico Hoerner banked +2.3 defensive wins, Corey Seager matched him, Pete Crow-Armstrong chipped in +2.0 — while Shohei Ohtani (−1.7) and Juan Soto (−1.3) handed runs back with the glove. For most of these names offense is the big lever, sure. But defense decides things at the margins, and defense, as it happens, is exactly where the two WAR models part company the hardest.
Defense: DRS versus the Statcast model
If two WAR figures disagree for a position player, defense is usually the culprit. Baseball-Reference builds its fielding component on Defensive Runs Saved (DRS) from Sports Info Solutions. FanGraphs historically used Ultimate Zone Rating (UZR) and has since moved to a Statcast-based fielding measure built on tracking data — catch probability, outs above average, and the rest.
Here’s the rub: these systems watch the identical plays and routinely come back with different verdicts. They slice the field into zones differently, weigh the difficulty of a play differently, treat positioning differently. A shortstop who grades out at +12 runs in one system can show up at +6 in the other — and that six-run gap is more than half a win, enough on its own to explain why one site has a guy at 5.5 and the other at 6.1. Neither is “wrong,” and I’d push back on anyone who says otherwise. Defense is simply the hardest thing in this sport to put a number on, and two reasonable models fed different data are going to disagree by a few runs. So when two WAR figures split on a position player, check the gloves first. It’s almost always the gloves.
Pitching: RA9 versus FIP, the real fault line
For pitchers the divide is even wider, and it is philosophical. Baseball-Reference computes pitching WAR from runs the pitcher actually allowed — an RA9 foundation — then applies a team-defense adjustment so a pitcher is not blamed for, or credited with, the fielders behind him. The premise: a run that scored is a real run, so start from what happened on the field.
FanGraphs takes the opposite stance. Its pitching WAR is built on Fielding Independent Pitching (FIP), which ignores what happened on balls in play entirely and rebuilds a pitcher’s line from the three outcomes he most controls: strikeouts, walks, and home runs. The premise: WAR should measure what the pitcher himself did, not the defense or the sequencing luck wrapped around it.
This one choice is the biggest source of pitcher-WAR disagreement, full stop — bigger than the gloves, bigger than anything. A pitcher who keeps allowing weak contact and stranding runners, whose ERA sits comfortably below his FIP, will look far better in bWAR than in fWAR, because bWAR banks the prevented runs while fWAR insists those runs were partly luck biding its time. Run it the other way and a pitcher who got hammered on balls in play comes out ahead at FanGraphs. The same arm can be a five-win pitcher on one site and a four-win pitcher on the other, and — this is the part worth sitting with — both are right within their own logic. They’re just answering different questions about what a pitcher fundamentally is.
Positional adjustments and the smaller knobs
WAR rewards playing a hard position. A shortstop and a first baseman who hit identically are not equally valuable, because shortstop is far more demanding, so WAR adds runs for up-the-middle positions and subtracts them at the corners. Both sites do this, but the exact adjustment differs by a couple of runs per position, and those small differences accumulate. Add slightly different baserunning models and different offensive park factors, and you have several more places where two honest calculations drift a few tenths apart.
None of this is a flaw, and I’d gently resist the urge to treat it as one. These are the visible seams of an estimate trying to crush a whole season into a single number. The seams are simply where the human judgment had to go somewhere, and it went here.
An honest note on this data
The table above is real bWAR pulled straight from Baseball-Reference, with its true offensive and defensive components. We would love to print the matching fWAR column beside it — that side-by-side is the cleanest way to see these gaps — but FanGraphs blocks automated access, returning an HTTP 403 to scripted requests. Rather than fabricate the fWAR figures, we have shown the bWAR components honestly and explained how fWAR would differ: it would re-rate every glove with its Statcast fielding model and, for pitchers, swap runs-allowed for FIP. If you want the exact comparison today, the right move is to open both sites and read the two numbers yourself.
The bottom line
WAR is a framework, not a measurement, and bWAR and fWAR are two careful implementations of that framework that diverge on defense (DRS versus a Statcast model), on pitching (runs allowed versus FIP), and in the fine print of positional and park adjustments. Use both. When they agree, you can trust the verdict. When they disagree, the gap is information — it is pointing at a glove rating or a pitcher’s contact luck, and that is worth a closer look. The one unforgivable move is mixing them: never put one player’s bWAR next to another’s fWAR and call it a comparison. Pick a version, know which defensive and pitching models it runs on, and stay inside it.
Sources & Further Reading
- WAR leaders and components: Baseball-Reference. Numbers retrieved June 2026; re-runnable via
scripts/war_sources.py. - FanGraphs — the fWAR implementation, including its FIP-based pitching WAR and Statcast fielding component.
- MLB.com — background on Statcast tracking data that underpins modern fielding metrics.