Here is the problem with errors and fielding percentage, in one sentence: a shortstop who never moves can’t make a mistake. He stands still, lets the tough ball roll past for a single, and his fielding percentage stays spotless — while the rangy defender who reaches it and bobbles it gets charged with an error. Everyone watching knew which shortstop was better. The stat sheet flatly disagreed. Outs Above Average — OAA — is Statcast’s answer, and it finally measures the thing scouts always cared about: range.
Instead of waiting for a misplay, OAA evaluates every single ball hit toward a fielder and asks how hard that play actually was. The result is the first defensive metric built from the physics of the play itself rather than the judgment of a scorer in the press box.
How OAA is built
The engine underneath OAA is catch probability. For every ball put in play, Statcast knows where the fielder started, where the ball was going, and the clock that connected them. From years of tracking data it converts those inputs — how far the fielder has to go, how much time he has to get there, and which direction he must travel — into a probability that an average fielder at that position makes the play. A routine fly ball might carry a 99% catch probability; a screaming liner into the gap might be a 25% play; a slow roller deep in the hole, a 40% play.
From there the accounting is almost disarmingly simple. A fielder is credited the difference between the outs he actually made and the outs he was expected to make. Convert that 25% play and you bank 0.75 of an out; let a 90% play drop and you lose 0.90. Sum every play over a season and you get Outs Above Average: the net number of outs this defender produced beyond what a league-average player at his position would have, given the exact same chances.
Because outs are not all worth the same in run terms — a robbed extra-base hit prevents more damage than a routine grounder — Statcast also translates OAA into runs. That run-denominated version is Fielding Run Value, the form in which defense feeds directly into all-encompassing value metrics. The table reports both the raw outs and the runs saved for each fielder.
What a good number looks like
OAA is centered so that zero is exactly average — a fielder who makes precisely as many outs as expected lands at 0, no credit and no blame. From there the scale is intuitive. A few outs in either direction is ordinary noise. Around +5 marks a clearly above-average defender. Reaching +10 to +15 over a full season is genuinely excellent, the territory of players who change games with their gloves. Anything north of +20 is an elite, award-caliber campaign.
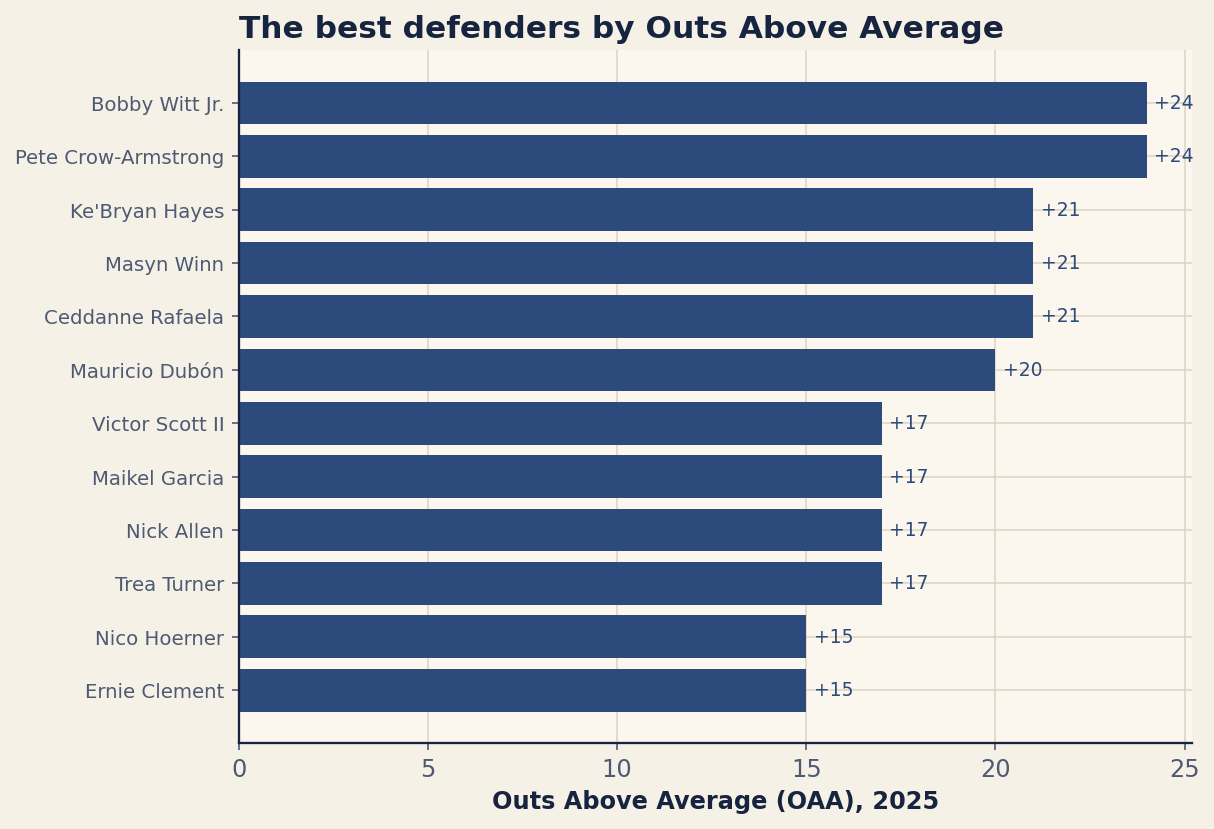
The 2025 leaderboard puts faces on those tiers. Bobby Witt Jr., a shortstop, topped the field at +24 OAA, worth 18 runs saved — a number that quietly argues he was one of the most valuable players in the sport before he ever swung a bat. Witt shared the top mark with Cubs center fielder Pete Crow-Armstrong, also at +24 but worth 22 runs, a reminder that the same out total converts to more runs in the outfield, where the plays prevented tend to be extra-base hits rather than singles.
| Player | Pos | OAA | Runs Saved |
|---|---|---|---|
| Bobby Witt Jr. | SS | 24 | 18 |
| Pete Crow-Armstrong | CF | 24 | 22 |
| Ke'Bryan Hayes | 3B | 21 | 16 |
| Masyn Winn | SS | 21 | 16 |
| Ceddanne Rafaela | CF | 21 | 19 |
| Mauricio Dubón | 2B | 20 | 15 |
| Victor Scott II | CF | 17 | 15 |
| Maikel Garcia | 3B | 17 | 13 |
| Nick Allen | SS | 17 | 13 |
| Trea Turner | SS | 17 | 13 |
| Nico Hoerner | 2B | 15 | 11 |
| Ernie Clement | 3B | 15 | 11 |
Run down the rest of the list and a pattern emerges: it is dominated by shortstops, center fielders, and third basemen — the positions where range matters most and where there is the most ground to cover. Ke’Bryan Hayes at third, Masyn Winn and Trea Turner at short, Ceddanne Rafaela in center: these are the spots where a great defender separates himself by the widest margin, and OAA rewards exactly that separation.
Why it beats the old metrics
Set OAA beside the tools it replaced and the gap is stark. Fielding percentage and error totals only ever measured cleanliness on balls a fielder already reached; they are blind to range, which is the single largest component of defensive value. A shortstop who never dives never makes an error, and the old stats would call him flawless.
The more serious predecessor was Defensive Runs Saved (DRS), and OAA’s advantage over it is the input. DRS leans heavily on video-charted hit locations and zone-based estimates of where an average fielder would have gotten to. OAA throws that out in favor of measured tracking data — the actual start point, the actual hang time, the actual distance covered. It is not asking a charter to guess whether a play was makeable; it is calculating the makeability from the geometry. That is why OAA tends to be the more stable, more trusted range metric of the two, even though both are trying to measure the same underlying skill and usually agree on who the standouts are.
Where OAA stops short
No defensive number is the last word, and OAA has real boundaries worth respecting. The biggest is positioning. OAA measures a fielder from where he started the play, which means a defender who is expertly positioned by his coaching staff gets credited for plays that good pre-pitch alignment, not just his own range, helped him reach. With infield shifts curtailed by rule, this matters less than it once did, but team positioning systems still blur the line between individual skill and organizational strategy.
OAA is also deliberately partial in scope. For catchers it does not attempt to capture framing, blocking, or throwing — those skills are graded by separate Statcast metrics and folded into catcher value elsewhere — so you should never read a catcher’s overall defensive worth off OAA alone. And like every fielding stat, it is sample-hungry. Defensive chances accrue slowly; a fielder simply does not get enough difficult plays in a month for the number to settle. Half a season of OAA is suggestive; a single month is mostly noise, and even a full year carries more uncertainty than an equivalent slice of offensive data.
Why defense splits the WAR models
This is the deeper reason OAA matters for anyone who reads value stats. Offense is measured almost identically everywhere — a double is a double, and the run values are settled. Defense is not. The major WAR models disagree in large part because they make different choices about how to grade gloves: one framework may build its defensive component on OAA and Fielding Run Value, another on DRS, and the two can diverge by a win or more for a player whose defensive reputation is contested.
So when Baseball-Reference and FanGraphs hand you two different WAR totals for the same shortstop, the fielding input is usually the first suspect. Knowing how OAA is constructed — catch probability, outs above expected, runs saved — lets you look under the hood and judge for yourself which defensive grade you trust, rather than treating the final WAR figure as a single unarguable verdict.
The bottom line
Outs Above Average did for defense what wOBA did for hitting: it replaced a misleading traditional number with one built from what actually happened on the field. It measures range — the part of fielding the old stats couldn’t see — by turning every batted ball into a catch probability and crediting the fielder the difference between outs made and outs expected. Read it with its limits in mind: respect the sample, remember that positioning and catcher skills live elsewhere, and treat Bobby Witt Jr.’s +24 for what it is — not a fluke, but the measured output of a shortstop who got to balls almost no one else would have.
Sources & Further Reading
- The underlying math is worked through in Chapter 22: Correlation and Simple Linear Regression (free, DataField.dev).
- Leaderboard data: Baseball Savant (Outs Above Average leaderboard, with catch-probability methodology). Numbers retrieved June 2026; re-runnable via
scripts/oaa_leaders.py. - MLB.com — Statcast glossary entries for Outs Above Average and Fielding Run Value.
- FanGraphs — Defensive Runs Saved and the role of fielding metrics in WAR.